• Cleveland QLD 4163 Find us on Facebook

  • What Are the Top Energy Solutions for Global Buyers in 2026?

    Global energy buyers enter 2026 under pressure from rising demand, stricter emissions rules, and uncertain power markets. They need practical energy solutions, not attractive promises alone. Solar photovoltaic systems, battery storage, heat pumps, smart controls, and cleaner fuels now compete for limited capital. Each option carries different costs, risks, and operating requirements.

    A reliable purchasing decision starts with real site conditions. A factory in Vietnam may need rooftop solar, thermal storage, and backup power during grid interruptions. A European warehouse may prioritize heat pumps, insulation, and flexible electricity contracts. Buyers should examine equipment quality, supplier experience, maintenance coverage, warranties, cybersecurity, and local certification. Independent performance data matters. So does the installer’s record after commissioning.

    No portfolio is flawless. That matters. Battery degradation can reduce expected savings, while weak grid infrastructure may limit renewable projects. Forecasts can also miss weather patterns, financing changes, or delayed permits. Responsible buyers should test several scenarios and request transparent assumptions. They should compare total ownership costs, not only purchase prices. Life-cycle emissions, recycling plans, worker safety, and supply-chain traceability deserve equal attention.

    This article examines the leading energy solutions shaping global procurement in 2026. It considers where each technology works best, which buyers may benefit, and what risks require closer review. The goal is not to promote one universal answer. Energy strategy depends on geography, load profiles, budgets, regulations, and operational priorities. Careful evidence should guide the final choice.

    What Are the Top Energy Solutions for Global Buyers in 2026?

    Global Energy Demand and Market Priorities in 2026

    Global Energy Demand and Market Priorities in 2026

    Global energy demand is rising unevenly across regions. Hotter summers are increasing cooling needs, especially in fast-growing cities. Data centers and industrial electrification are also adding steady pressure to power grids. Buyers now prioritize reliable supply, predictable costs, and lower emissions. A cheap contract means little when outages stop production.

    The strongest energy strategies combine renewable generation, battery storage, grid upgrades, and efficiency measures. Solar and wind can reduce fuel exposure, while storage helps manage evening demand. Smart meters, efficient motors, and better building controls can deliver savings before new power plants are built. Buyers should examine local weather, transmission limits, and seasonal demand before selecting a solution. Forecasts still miss sudden price shocks. A perfectly optimized energy mix is unrealistic.

    Tips: Compare total operating costs, not only equipment prices. Request verified performance data and clear maintenance terms. Test a small project before expanding it. Keep backup capacity for cloudy weeks, extreme heat, or delayed grid connections. Review the plan every six months, because demand patterns can change faster than contracts.

    Renewable Power Solutions for Different Buyer Needs

    What Are the Top Energy Solutions for Global Buyers in 2026?

    Renewable Power Solutions for Different Buyer Needs

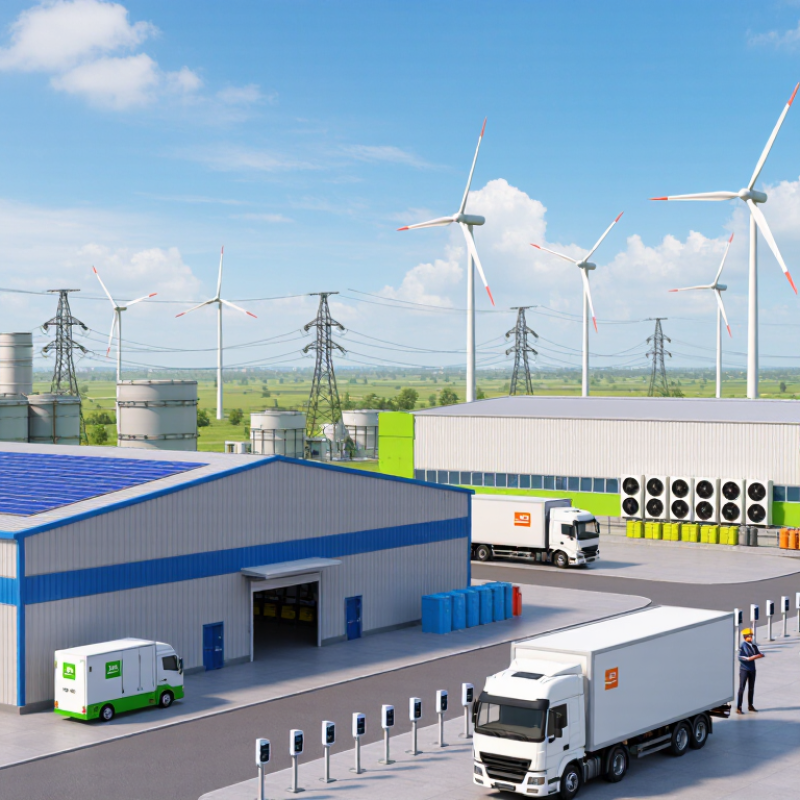
    Global buyers in 2026 are choosing renewable power by operating reality, not headline capacity. A coastal factory may need steady wind supply, while a remote clinic needs simple solar storage. These are different problems. Solar photovoltaic systems suit sites with strong daylight, clear roof space, and predictable daytime demand. Battery storage can shift midday generation into evening production, but it adds cost, heat, and maintenance.

    Commercial buildings often benefit from solar panels paired with smart energy controls. These controls can reduce peak demand when air-conditioning loads rise. Manufacturing sites may require a hybrid system using solar, wind, storage, and grid power. A careful energy audit should examine hourly consumption, weather patterns, roof strength, backup requirements, and local grid rules. Annual generation figures alone can mislead buyers.

    Remote communities may need modular microgrids with durable batteries and easy-to-replace components. Water treatment facilities need reliable power, even during cloudy periods. Buyers should request performance data from comparable climates, clear warranty terms, and independent engineering reviews. Local technicians also matter. A technically excellent system can underperform when spare parts arrive slowly. I have seen projects focus heavily on panel output while overlooking cable losses and battery temperature. That mistake is costly. Renewable planning still involves trade-offs, and some forecasts remain uncertain.

    Energy Storage, Smart Grids, and Supply Reliability

    Global buyers in 2026 are prioritizing energy systems that remain dependable during price shocks, extreme weather, and grid congestion. Energy storage has become a practical buffer, not merely a backup asset. Lithium-based and alternative storage systems can shift solar power into evening demand. They also support critical loads during short outages. However, nameplate capacity can mislead buyers. Real output depends on temperature, degradation, inverter limits, and maintenance quality.

    Smart grids make these assets more useful. Digital meters can identify demand spikes within minutes. Automated controls can then reduce nonessential consumption or dispatch stored power. A strong project includes local grid-code compliance, secure communications, and clear human oversight. Field experience shows that simple interfaces often outperform complex systems during stressful events. Data is valuable. Clean, verified data is better. Buyers should request independent performance tests, commissioning records, and transparent cybersecurity procedures.

    Supply reliability also depends on the less visible details. Spare components, trained technicians, emergency drills, and realistic delivery schedules matter. A storage site beside a factory may need fire protection, thermal monitoring, and separate circuits for essential equipment. Remote regions may require hybrid systems with multiple generation sources. No plan is flawless. A storm can damage transmission lines, while a software update can create unexpected delays. Procurement teams should test these weaknesses before signing long-term contracts, then review performance against measured availability rather than optimistic forecasts.

    Low-Carbon Fuels and Industrial Decarbonization Options

    In 2026, global buyers are prioritizing low-carbon fuels that fit existing industrial systems. Green hydrogen can serve steel, chemicals, refining, and heavy transport. The International Energy Agency’s Global Hydrogen Review 2024 reports that low-emissions hydrogen remains below 1% of global production. That gap creates opportunity, but also exposes serious delivery risks. Announced projects are not the same as operating supply.

    Industrial electrification is often the most efficient option for low and medium-temperature heat. High-temperature processes may need hydrogen, biomethane, renewable methanol, or sustainable biofuels. The IEA’s Energy Technology Perspectives 2024 estimates that industry produces roughly 9 gigatonnes of annual carbon dioxide emissions. Direct electrification should therefore be tested before purchasing alternative fuels. It can reduce conversion losses and simplify emissions reporting.

    Hard problems remain. Carbon capture may support cement, lime, and chemical plants where process emissions cannot disappear through efficiency alone. However, buyers must verify storage quality, transport access, lifecycle emissions, and permanence. The Intergovernmental Panel on Climate Change identifies carbon capture as part of several credible net-zero pathways, but not as a substitute for reducing fossil fuel demand. The best procurement plans combine renewable power, efficiency upgrades, and carefully certified low-carbon fuels. Costs, infrastructure, and local regulation still vary sharply across regions. Some forecasts may prove too optimistic. On-site trials, transparent emissions data, and supplier audits can reveal those weaknesses before long-term contracts begin.

    How Global Buyers Can Compare and Select Energy Solutions

    Global buyers in 2026 should compare energy solutions by operating conditions, not headlines. Solar generation, battery storage, efficient heat pumps, and local microgrids serve different needs. A factory with daytime demand may value solar power. A remote site may need storage and backup capacity. The cheapest quotation can become expensive after installation, maintenance, and grid upgrades.

    A reliable comparison starts with measurable evidence. Review total cost over the system’s expected life, including equipment, labor, financing, insurance, and replacement parts. Check seasonal performance, response time, energy losses, and safety records. Ask suppliers for independently verified test results and references from similar climates. A cold warehouse in northern Europe should not copy assumptions from a hot, humid facility in Southeast Asia. Conditions change everything.

    Procurement teams should also examine permitting, local standards, repair networks, data security, and end-of-life handling. Score each option against carbon impact, resilience, payback period, and expansion potential. Keep the scoring transparent. No scorecard is perfect. Energy prices shift, weather forecasts fail, and projected savings may disappoint. A small pilot can expose weak assumptions before a full investment. Speak with operators, not only sales teams. Their maintenance logs often reveal the practical truth. The strongest choice is usually the solution that performs consistently, remains serviceable, and fits the buyer’s real demand profile.

    What Are the Top Energy Solutions for Global Buyers in 2026? - How Global Buyers Can Compare and Select Energy Solutions

    Indicative comparison for commercial, industrial, utility-scale and public-sector buyers. Costs and performance vary by country, financing conditions, grid connection, resource quality, taxes and project design.

    Energy Solution Typical Project Scale Indicative 2026 Cost Range Typical Operating Life Dispatchability and Reliability Emissions Profile Best-Fit Buyer Applications Key Constraints Selection Priority
    Utility-Scale Solar Photovoltaics 5 MW to more than 1 GW per project Indicative levelized cost of electricity: approximately US$30–90/MWh before local incentives and grid costs 25–35 years for modules; inverters commonly replaced earlier Variable output; strongest during daylight hours. Forecasting and storage improve firm supply. Very low operational emissions; lifecycle emissions are commonly estimated at roughly 20–60 gCO₂e/kWh, depending on manufacturing and location. Low-cost bulk generation, corporate power procurement, daytime industrial demand and new-grid capacity Land use, intermittency, transmission access, curtailment and permitting ★★★★★
    Commercial and Industrial Solar PV 100 kW to 20 MW, usually rooftop, carport or behind-the-meter ground mounted Approximately US$600–1,800/kW installed, depending on labor, roof condition, grid rules and project size 20–30 years for modules; 10–15 years is common for inverter replacement planning Reduces daytime grid purchases but does not provide firm power without batteries or backup generation. Very low operational emissions and no fuel combustion on site Factories, warehouses, retail facilities, campuses and sites with high daytime electricity demand Roof structure, limited site area, export restrictions and seasonal production ★★★★★
    Onshore Wind Power 10 MW to more than 500 MW per project Indicative levelized cost of electricity: approximately US$30–75/MWh in favorable wind regimes 20–30 years, with major-component replacement possible Variable but often complementary to solar, especially where nighttime or winter wind resources are strong. Very low operational emissions; lifecycle emissions are commonly estimated at roughly 8–20 gCO₂e/kWh. Bulk renewable generation, long-term power contracts and regions with strong wind resources Transmission, visual and noise concerns, wildlife assessments, weather exposure and permitting ★★★★★
    Offshore Wind Power 300 MW to more than 2 GW per project Approximately US$75–140/MWh for new projects, highly dependent on financing, vessels and supply-chain costs 25–35 years Higher and often more consistent capacity factors than many land-based sites, but still weather dependent. Low operational emissions; lifecycle emissions are generally low but construction intensity is higher than for onshore wind. Coastal load centers, land-constrained markets and large-scale clean-power procurement High capital cost, marine construction, ports, subsea cables and complex environmental approvals ★★★★☆
    Grid-Scale Lithium-Ion Battery Storage 10 MW to 500+ MW; usually 1–8 hours of energy duration Approximately US$200–450/kWh installed for four-hour systems, excluding some grid-upgrade costs 10–20 years, depending on cycling, temperature and augmentation strategy Fast response and highly controllable; suitable for peak shifting, frequency regulation and renewable firming. No direct operational emissions; lifecycle impacts depend on mining, manufacturing, charging source and recycling. Renewable integration, peak-demand reduction, ancillary services and backup during short outages Degradation, thermal management, fire-safety requirements, supply-chain exposure and limited long-duration capability ★★★★★
    Long-Duration Energy Storage 10 MW to several hundred MW; commonly 8–100+ hours Technology dependent; early commercial systems commonly exceed lithium-ion cost for short duration but can become competitive for multi-day storage 15–40 years, depending on technology and maintenance requirements Designed for extended renewable shortfalls, multi-hour shifting or seasonal balancing; maturity varies significantly. Usually low operational emissions; lifecycle profile depends on materials, manufacturing and electricity input. High-renewables grids, remote systems, resilience planning and multi-day reliability needs Technology bankability, project finance, efficiency, permitting and limited operating history for some options ★★★★☆
    Geothermal Power 5 MW to 300 MW; resource dependent Approximately US$60–110/MWh for suitable conventional resources; exploration risk can materially increase total cost 30–50 years with reservoir management and equipment renewal Firm, high-capacity-factor generation that can provide baseload or flexible output in suitable locations. Low to moderate lifecycle emissions; direct emissions vary by reservoir and reinjection practice. Volcanic or high-heat regions, firm clean generation and grids with limited renewable flexibility Resource exploration risk, geographic limits, drilling cost, water management and induced-seismicity controls ★★★★☆
    Hydropower and Pumped Storage 10 MW to more than 5 GW for conventional hydro; 100 MW to several GW for pumped storage Existing-resource projects can be highly competitive; new-build costs vary widely from approximately US$40–150/MWh 50–100+ years for civil infrastructure with periodic equipment refurbishment Highly dispatchable; pumped storage provides large-scale balancing but consumes electricity when pumping. Very low operational emissions in most systems; reservoir methane emissions can be material in some climates. Firm generation, grid balancing, seasonal storage and systems with suitable topography or water resources Long permitting timelines, ecological impacts, social displacement, hydrology and major civil works ★★★★☆
    Green Hydrogen and Power-to-X 5 MW to several hundred MW of electrolyzer capacity; larger integrated projects are expanding Indicative production cost commonly around US$2–7/kg before transport, storage and conversion losses; strongly dependent on renewable electricity price and utilization Electrolyzers typically 15–25 years with stack replacement planning Hydrogen is storable and transportable, but round-trip electricity efficiency is low when reconverted to power. Potentially very low emissions when powered by additional renewable electricity; emissions increase if grid electricity is carbon intensive. Steel, chemicals, shipping fuels, fertilizers, heavy transport and applications difficult to electrify directly High electricity demand, water treatment, storage and transport infrastructure, certification and immature demand markets ★★★☆☆
    Biogas and Biomethane 0.5 MW to 50+ MW per facility, depending on feedstock availability Approximately US$70–180/MWh for electricity generation; costs vary substantially with feedstock and waste-handling value 15–25 years for generation equipment Dispatchable and suitable for controllable generation, renewable gas supply and combined heat and power. Can reduce net emissions when using waste residues and controlling methane leakage; sustainability depends on feedstock sourcing. Wastewater plants, farms, food processors, landfills and sites requiring controllable renewable heat or power Feedstock logistics, leakage control, air-quality rules, sustainability verification and limited resource scale ★★★☆☆
    Demand Response and Energy Management 100 kW to multi-GW portfolios across many sites Often lower capital cost than new generation; value is usually measured through avoided peak charges, flexibility payments and reduced energy purchases Software and controls: 5–15 years; participating loads require ongoing operational management Fast response for eligible loads, but availability depends on customer processes, comfort limits and contractual commitments. Usually very low direct emissions; emissions impact depends on which generation is displaced or shifted. Commercial buildings, factories, data centers, cold storage and flexible industrial processes Customer participation, baseline measurement, cybersecurity, process disruption and market-access rules ★★★★★
    Integrated Microgrids 100 kW to 100+ MW, combining generation, storage, controls and optional backup Approximately US$1,000–4,000/kW for complex systems, excluding unusual civil works and network upgrades 15–30 years, depending on the mix of assets and control systems Can operate grid-connected or islanded; reliability depends on resource diversity, fuel availability and control design. Ranges from low to moderate depending on the mix of solar, storage, generators and fuels. Hospitals, campuses, ports, remote communities, factories and critical infrastructure Integration complexity, protection settings, controls interoperability, permitting and maintenance capability ★★★★★
    How buyers should compare: evaluate total cost of ownership rather than headline equipment price. Key decision factors include levelized cost, firm capacity value, capacity factor, emissions intensity, local grid charges, interconnection time, land or water requirements, financing cost, supply-chain risk, safety requirements, resilience value and compatibility with the buyer’s load profile.
    Data basis: indicative ranges synthesized from widely used public benchmarks and technical assessments published through 2024, including international renewable-energy cost statistics, global energy outlooks, utility-scale storage cost surveys and lifecycle-emissions literature. Values are screening estimates for 2026 planning, not guaranteed quotations or project-specific financial forecasts.